AI is transformational technology. Practical applications within industries and organizations can solve problems and also create new business opportunities.
https://www.cbronline.com/news/ultimate-software-bought


AI is transformational technology. Practical applications within industries and organizations can solve problems and also create new business opportunities.
https://www.cbronline.com/news/ultimate-software-bought
What is automation? Why is it important? What does it mean to the human workforce?
Automation is defined as the use of automatic equipment in a manufacturing or other process or facility, with minimal or reduced human intervention.
Automation increases quality by allowing the ability to deliver in a consistent manner, increase the capacity to produce a large(r) volume of goods and lower the total cost for high volume repeatable processes or production of goods.
The idea that automation would replace a large part of the workforce is widespread, however there are organizations working towards a different future for humankind. The merger between humans and machines. What I believe will achieve the first version of Singularity – the convergence of humans, machines and AI.
Author Vernor Vinge outlines the following path to Singularity:
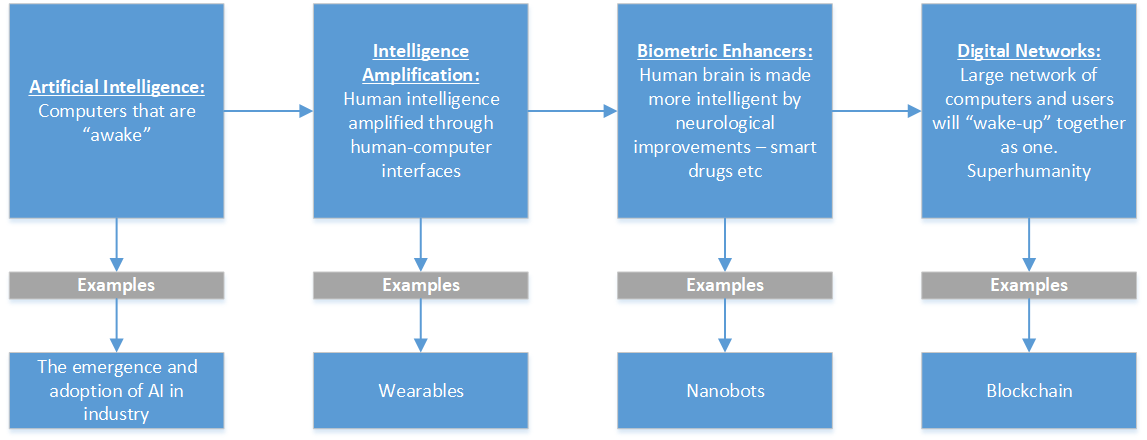
Cognition – All mental activities that are associated with processing, knowing, remembering, understanding and communicating.
Metacognition – Thinking about one’s thinking
The current AI systems strive for this and the way I see it, there isn’t a more powerful machine invented yet that has the innate ability to be truly cognitive other than the human brain. This leaves one option – the natural path towards achieving AI with cognitive capability is the merge of humans and machines.
Further reading:
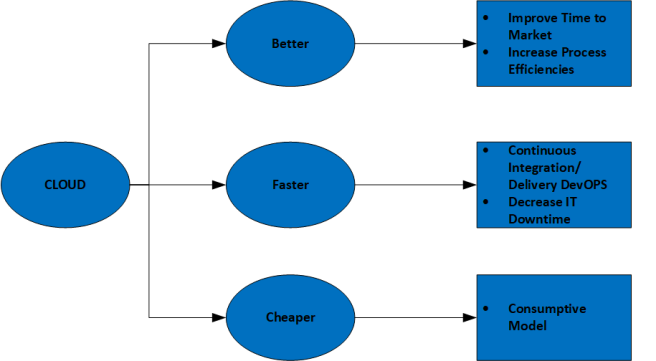
What is Cloud computing?
IT infrastructure that is run on the internet shared as a pool of resources. IT software that is run on the internet on top of shared infrastructure.
Is it enough to leave it up to the nerds to know what Cloud is, how it can be used, what tools are available?
You need nerds to translate the needs of the organization through code. Code, configuration, automation enables the organization to realize efficiencies through innovation. A philosophy, processes and champions don’t complete the formula.
With the high cost of IT and ever changing market dynamics, leaders are forced to understand the Cloud, tools available in order to drive investment decisions and to innovate while generating efficiencies.
The image below and the associated mindmap takes the Cloud puzzle apart, defines each component then puts it all back together stacked.


Consistency – “The quality of achieving a level of performance which does not vary greatly in quality over time” https://en.oxforddictionaries.com/definition/consistency
Innovation – “A new method, idea, product..” https://en.oxforddictionaries.com/definition/innovation
A fantastic write up on the following question – Why is consistent innovation difficult to achieve? http://innovateonpurpose.blogspot.com/2010/08/why-is-consistent-innovation-so.html
A great many interesting points raised by the writer to read and reflect.
“Isn’t it interesting that most businesses hold well defined processes in high esteem? They seek consistency, lack of variability and well-established workflow to cut down on costs, overhead and complexity. Yet when they consider innovation, it is rarely as a consistent effort or process, but in reaction to a life threatening event, and considered at best a one-time effort, not worthy of process development and definition.”
“…when it comes to doing new things, many businesses find it easy to start new initiatives but hard to replicate them. In contrast, once some new product, service or offering finds its way into the machinery of existing processes, they are hard to ever terminate. So we build barriers and make it difficult to create new things, and build barriers to terminating products and services that have lived well beyond their usefulness.”
My thoughts – Start with why your organizations seeks to innovate, ask why again and again until you have defined a clear outcome.
The journey is important, however more than direction, more than strategy, a definitive destination is the key.
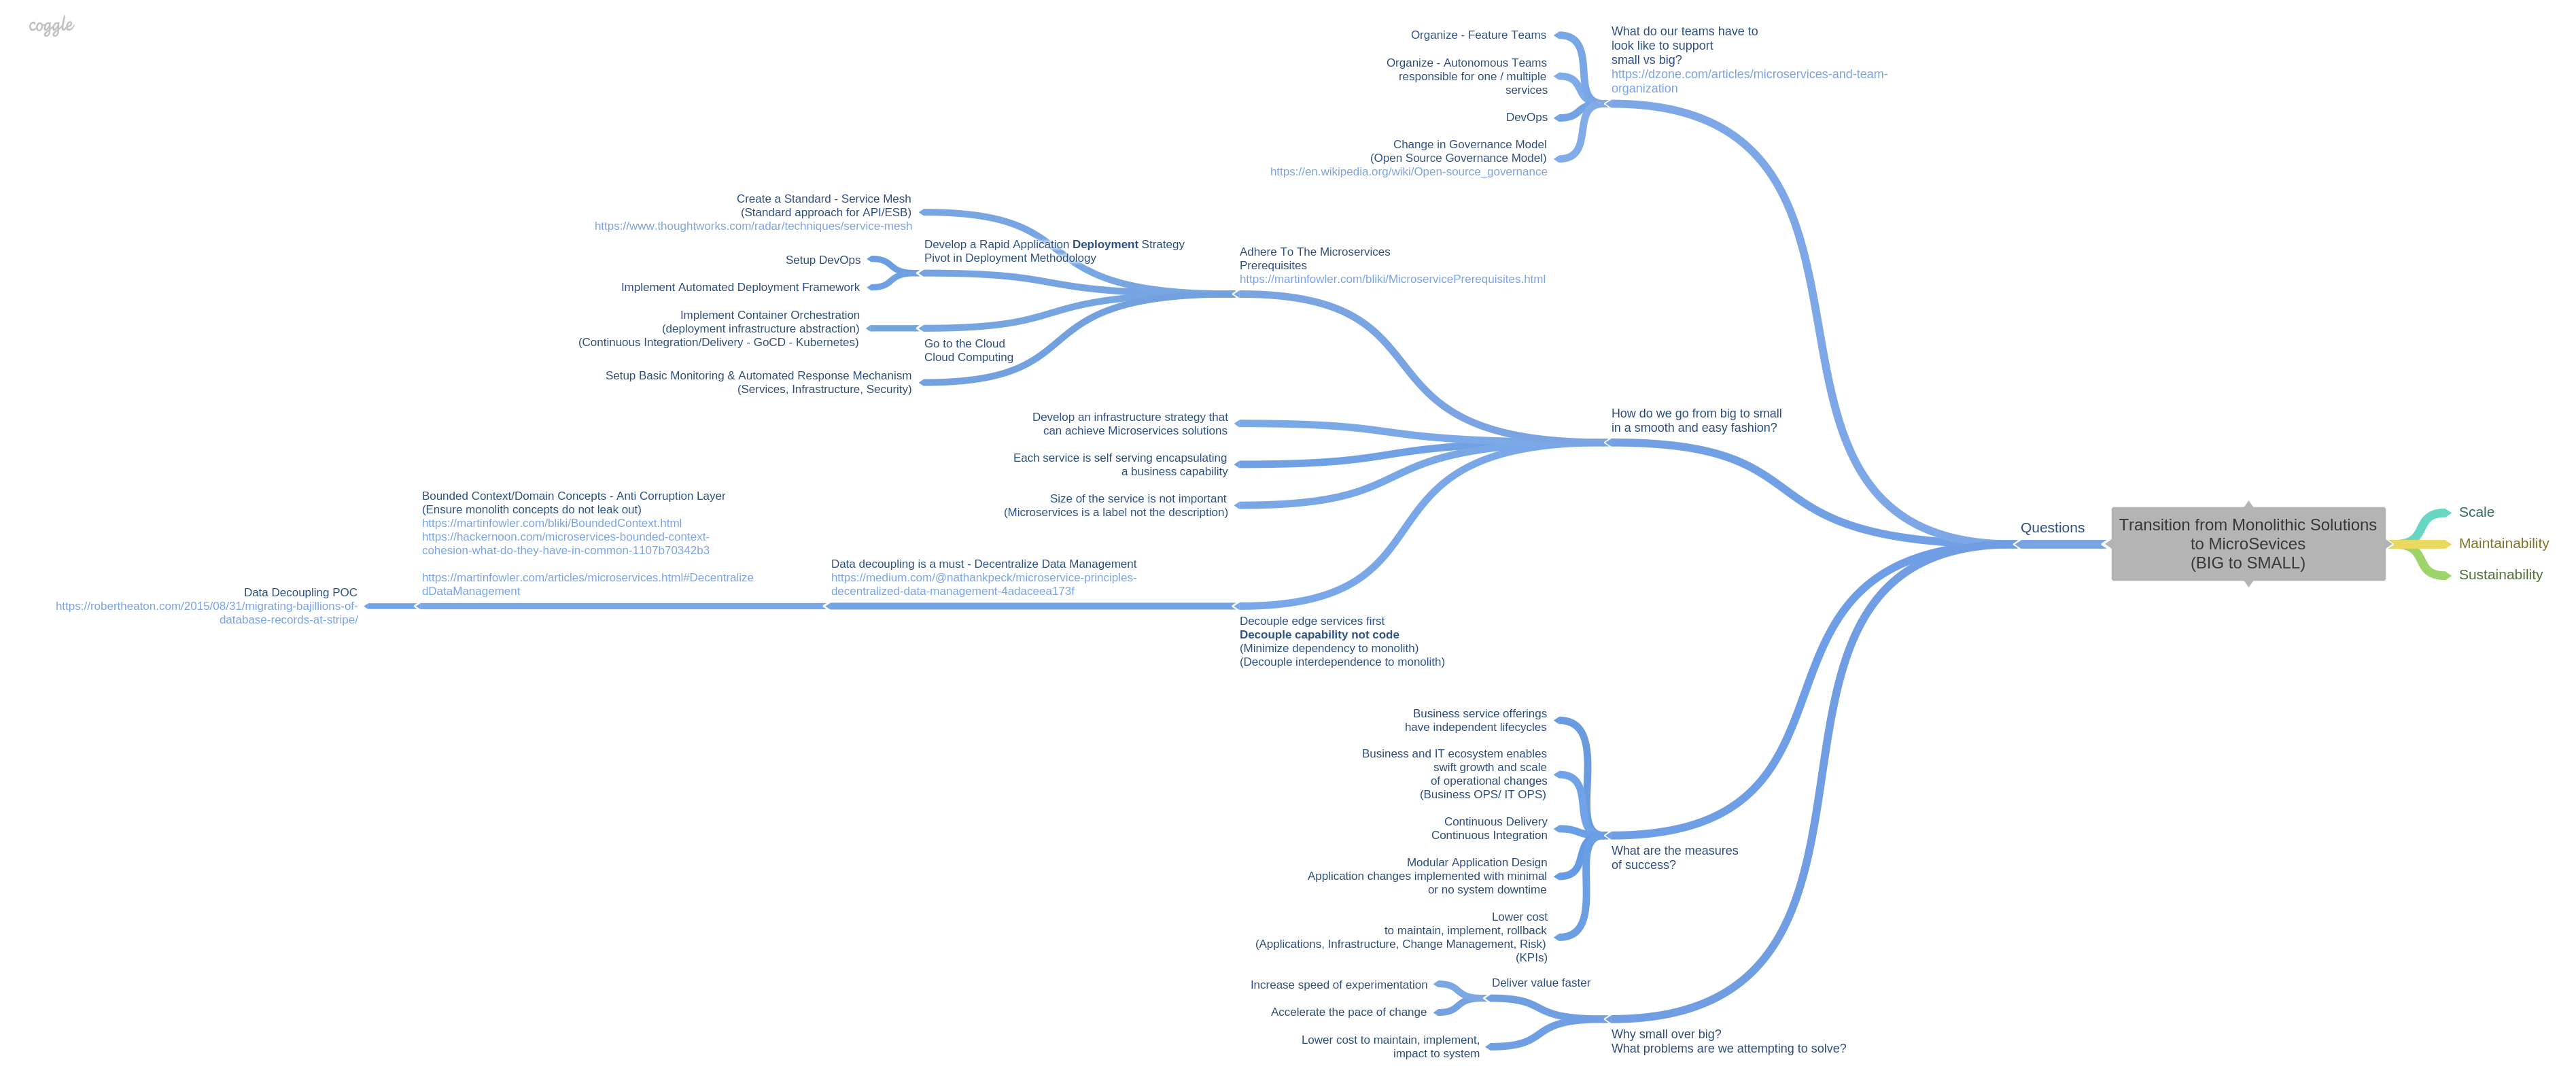
It’s easy to understand why monolithic applications are getting a bad rap:
The definition of Monolithic:
Translated – tightly coupled software presents difficulties in the current climate where the pace of change is ever increasing and the demand to lower costs while innovating, implementing, maintaining systems are high.
Three key areas of focus to adopt DevOps:
The intersection of the the above allows for
Strategies to achieve the above:
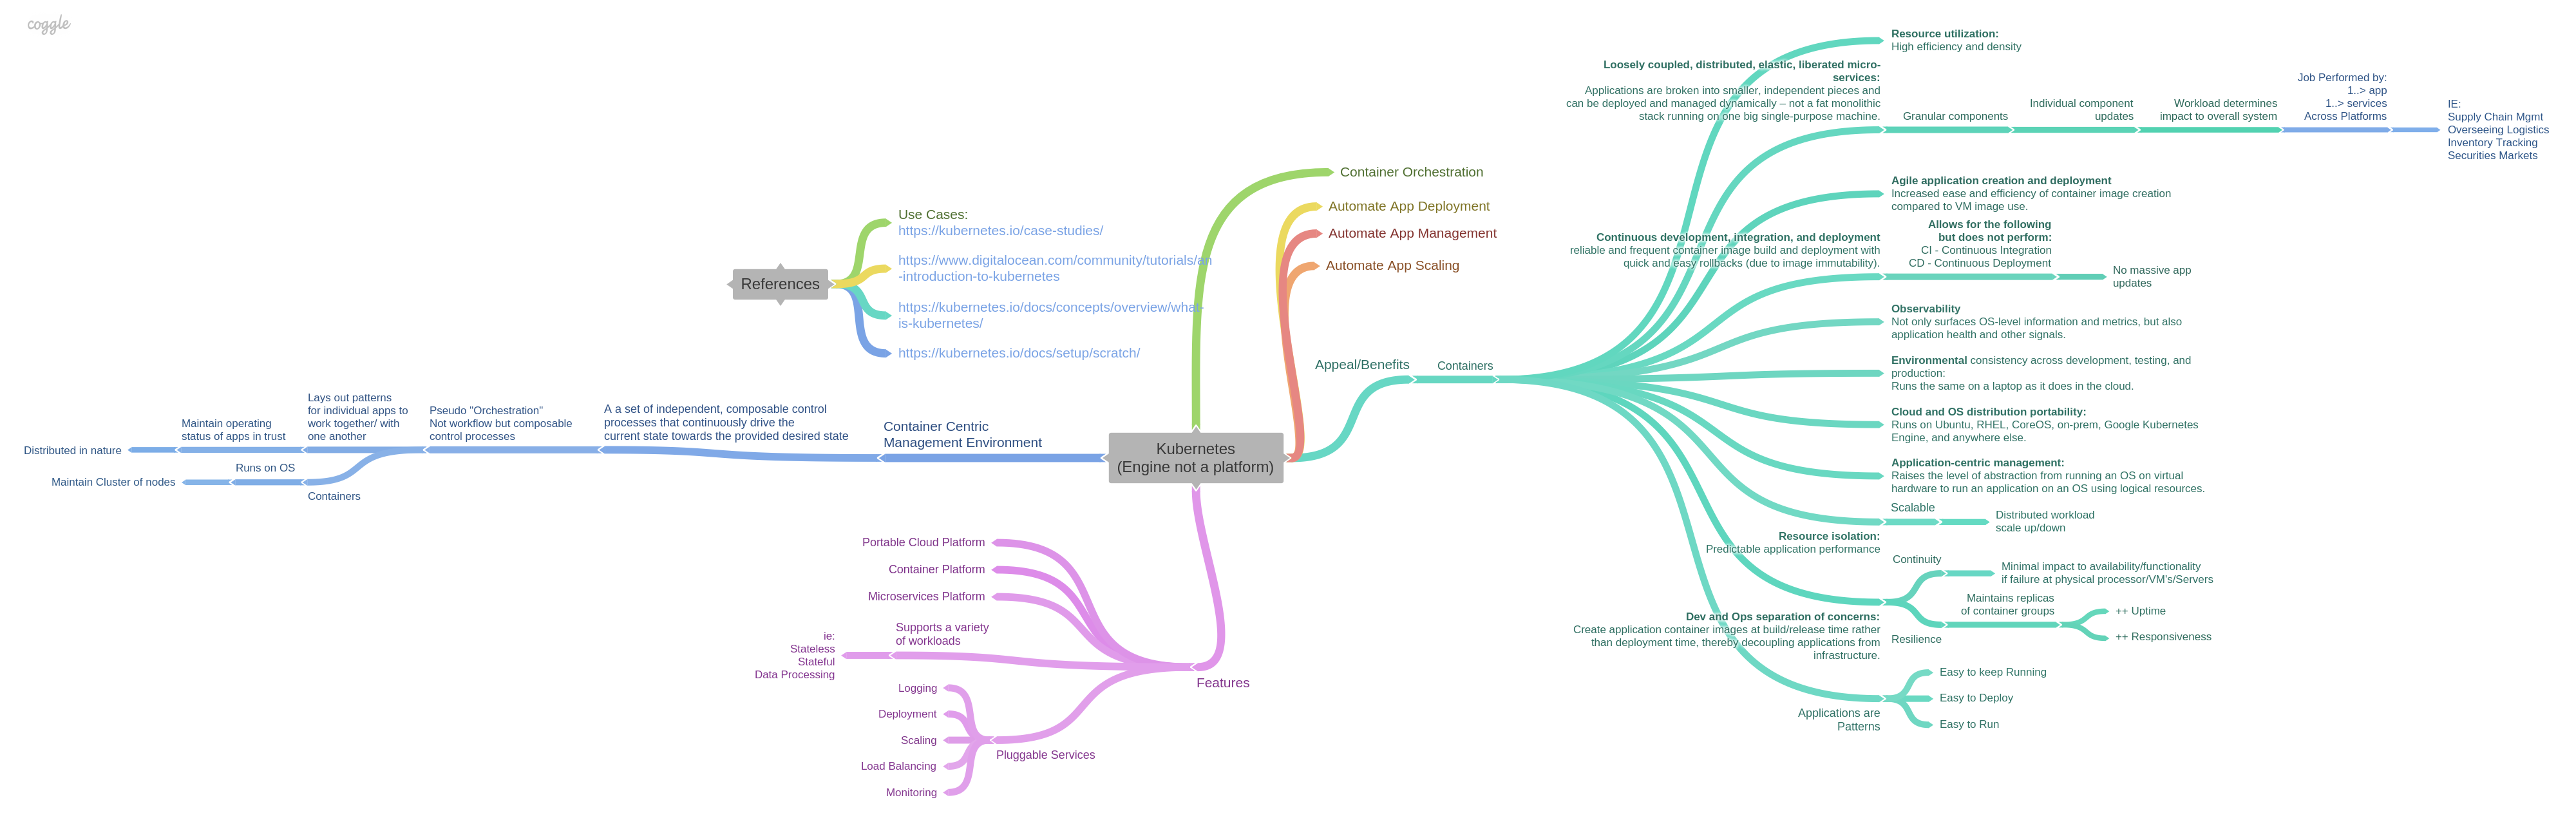
Kubernetes, at its basic level, is a system for running and coordinating containerized applications across a cluster of machines.It is a platform designed to completely manage the life cycle of containerized applications and services using methods that provide predictability, scalability, and high availability. (Intro to Kubernetes)
Powerful platform that organizations running cloud or on-premise data centers can benefit from in the following manner:
Read more here:
I’m messing around with this at the moment: TensorFlow.js
A JavaScript library for training and deploying Machine Learning models in the browser and on Node.js
TensorFlow.js is an open source WebGL-accelerated JavaScript library for machine intelligence. It brings highly performant machine learning building blocks to your fingertips, allowing you to train neural networks in a browser or run pre-trained models in inference mode.
I am working through proof of concepts for practical use cases of this technology.
Read this: https://js.tensorflow.org/
Check out the Mind Map that I created. It maps out the connectivity of TensorFlow.js leveraging GPU with technologies that leverage CPU.

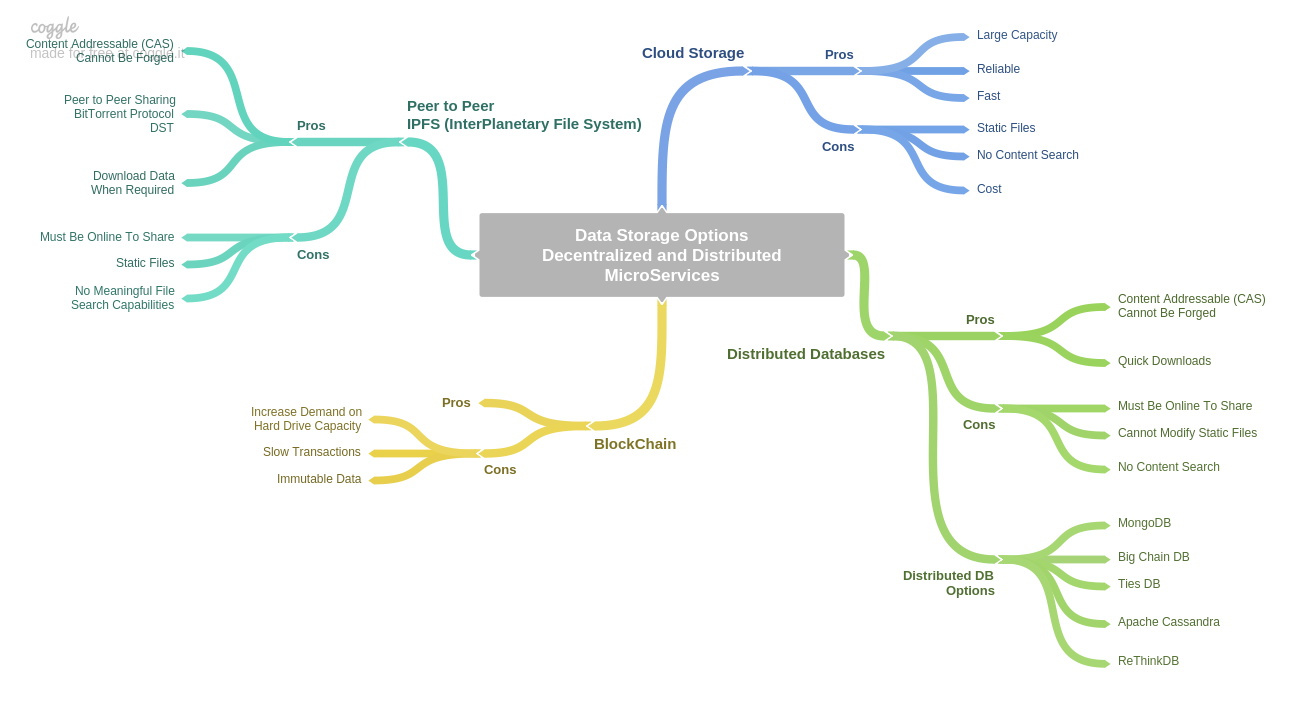
My mind map on Data Storage Options for Decentralized and Distributed MicroServices
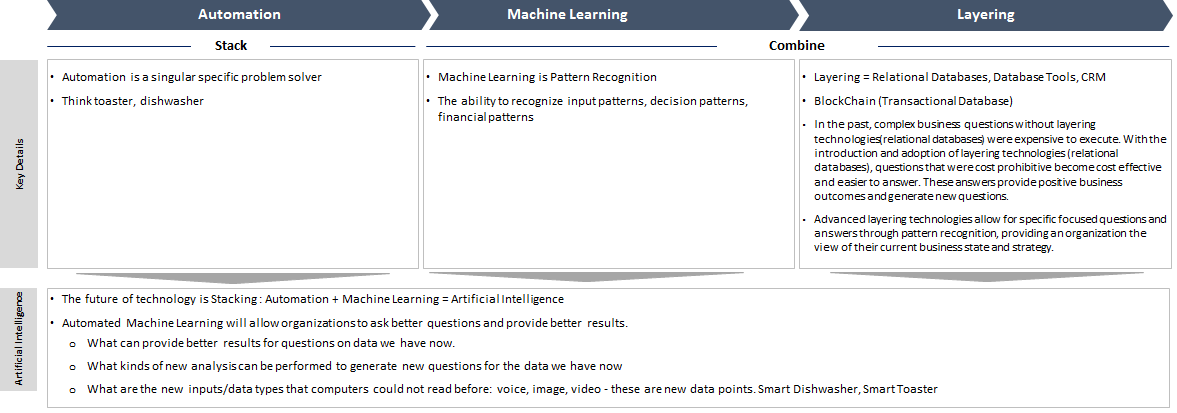
A visual on Automation. Machine Learning. Layering.

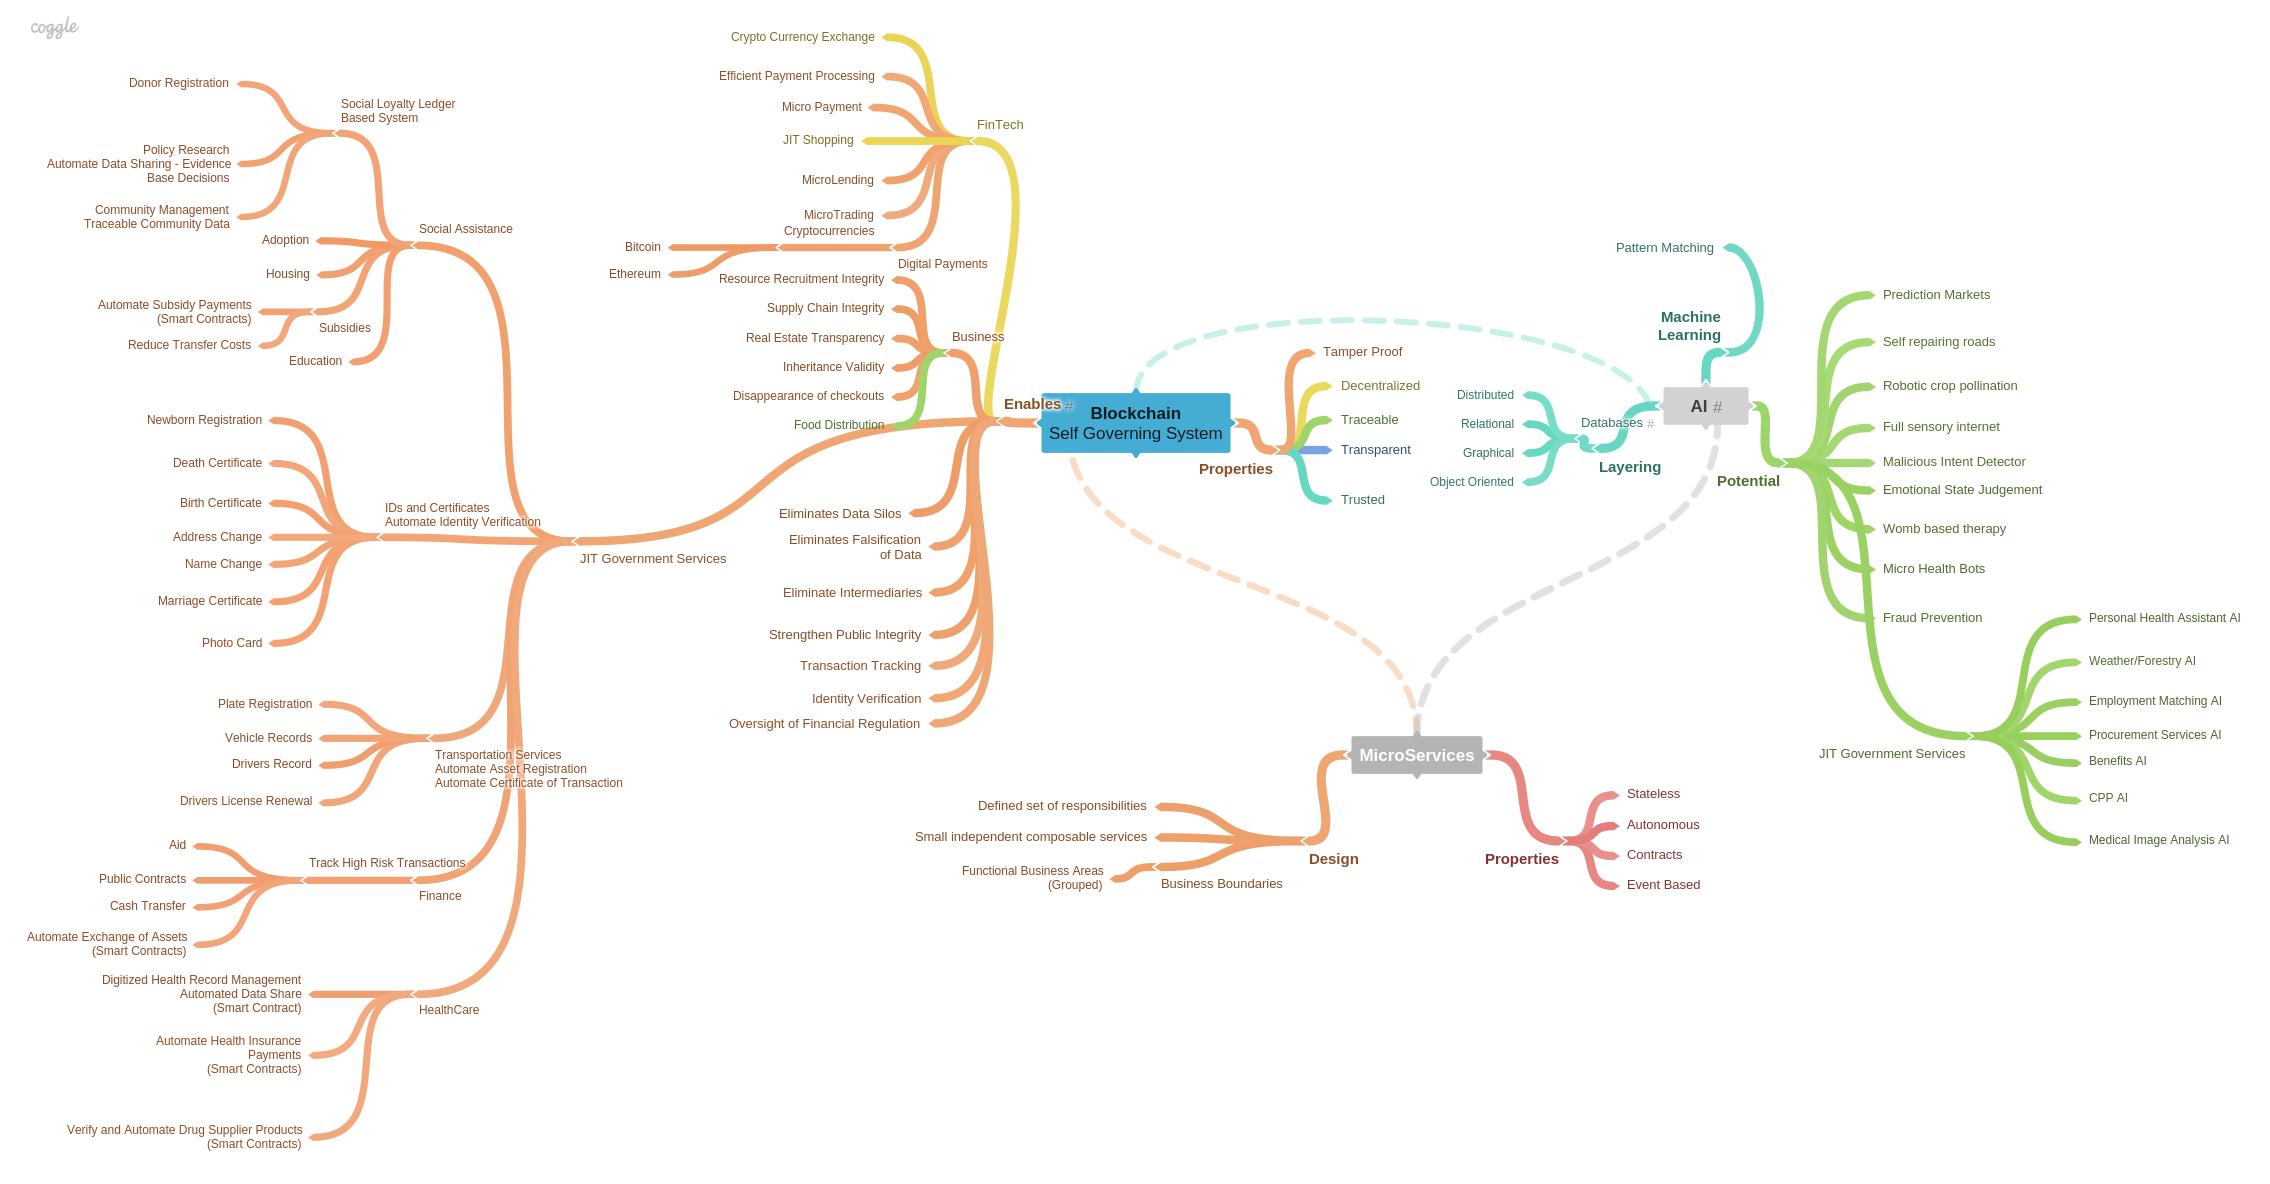
Blockchain has made it to the mainstream. It’s at the forefront of everyday discussion, and at the grassroots level, cryptokids are furiously creating tech ripples to impact technology and transform society.
There is quite a bit of hype around Blockchain and its potential to innovate, disrupt and transform traditional industries and business models, however the waters are murky. The struggle to innovate while navigating the uncertainty of Blockchain and how the technology fits, pivots and transforms an organization is not an easy task. The pressure to innovate and increase profitability, build an engaging and engaged workforce and to create a hospitable customer experience is at an all time high and is top of mind for thought leaders.
Regardless of the technology, philosophy or process, it’s imperative for organizations to empower their thought leaders to be persistent and pragmatic when setting direction with emphasis on their current and future needs.
Easy to say, hard to do.
It is more important than ever for thought leaders to structure a cohesive strategic plan of action delivering strategy through a clearly articulated tactical approach. How do organizations assess and decide on Blockchain, Machine Learning, AI, a new business philosophy for them to adopt? Question Quality. Ask better questions to get better answers.
Idea incubation requires thought leaders and organizations to employ a creative mindset. Perform iterative, frequent, intense and time sensitive creative deep thinking, honest discussion and embracing perspectives to generate valuable use cases.
Start with the following as guiding principles.
Understand what Blockchain provides us – 3TDACMS
Take the Blockchain fit assessment.
Apply the above data points creatively through various lenses. Transformative, Value Exchange (A pivot from the traditional transactional business interaction), Content Behavior (Flexible content to enrich human experience) to create ripples for your organization and society.
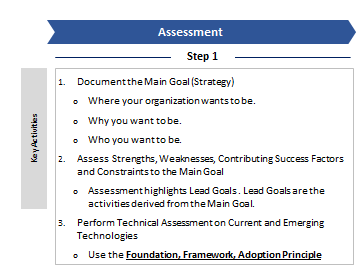
In future posts, I plan to write about the Foundation, Framework, Adoption Principle. This is my take on how organizations can further assess technology in order to determine tech to business fit and investment strategy.
I attended the fantastic CloudSec2018 event in Toronto today held at the St.James Cathedral Center.
The focus of the event centered around the following:
Machine learning and AI in cybersecurity – implementations or strategies incorporated in cybersecurity solutions or technologies
IoT/IIoT research – research on smart cities, vulnerabilities in infrastructure, and ICS/SCADA threats
Blockchains, cryptocurrencies, cryptominers – how these three are related, and how they impact cybersecurity
Vertical-specific threats – Threats or vulnerabilities that concern the healthcare and banking industries
Fake news and cyberpropaganda – the fake news underground economy, and how cyberpropaganda is beyond fake news and can impact organizations
All in all an interesting day with superb speakers and panelist hosted by Trend Micro. Name dropping:
Word cloud for the day:
What a fantastic day!! I encourage all of you to make it out to events such as this to listen, learn and network.
More information here: https://www.itworldcanada.com/client/cloud-sec-2018.html
Alvin

Muskrat Watershed Rehabilitation Project
Machine Learning The Key To Network Latency?
Google Cloud Machine Learning Documentation
Is BlockChain The Future of the Internet?
Cyber Attack on Natural Gas Pipelines
Have a fantastic week!
Alvin
Facebook Data Privacy
Cyber Attack – Ransomware Atlanta
Cyber Attack – British Sports Anti Doping Agency
MicroFinance
Amazon
Data Security
New Economy – Wind Turbine Drone Inspections
Space:
Climate Change:
Third Space:
MicroFinance:
Future Thinking: Look back then Look Forward
Enjoy your week!
Alvin

The Roadmap
It creates direction, charts a course, provides a path from information to value stream. All this is true and for the sake of simplicity let’s refer to it as a plan.
What is a plan? I refer to it as a consciousness shared amongst a group, individuals or society with a destination in mind.
We’ve all read the Facebook, Amazon, Netflix, Google startup journeys and are in awe at the sublime thought process that went into their creation eventually becoming what they are today. What were their initial plans like? How did they get their idea into a plan?
Tip: Breakdown the idea into smaller bits. Create a story board.
Take the idea and write without stopping. Write down what you think you will need before, during, after for success. Write down what you’re afraid will happen. Write down who you think you will need. Write down how you think you will accomplish the idea. Write down when you want to do it, why you think you need to do it.
Write it down!
Writing things down is essential to story telling. In my experience, the failure to write things down in its raw format is a red flag. It’s the first sign that you’re stuck in the loop of perfectionism. There is no such thing. Write it down. Review. Revise. Pause, then do it all over again.
No magic pills or shortcuts. It’s hard work – How bad do you want it.
Tip: Don’t let the deluge of information overwhelm you. Group, Sort, Categorize.
To quote William Gibson “Time moves in one direction, memory in another”.
Categorize activities into three distinct areas; Beginning, Middle, End.
Grouping and sorting are important however just as important is to categorize. Take what you’ve written down and sort into the 3 categories mentioned above.
This allows you to apply a time frame to your story and allows the concept of memory application to your story by going back in time to add or remove details.
Tip: Prep for Execution. Exercise Acuity.
The last step in the road-mapping process is the hardest.
“To exercise acuity in planning, we must speak out loud with bold humility” Me!
“Everything becomes a little different as soon as it is spoken out loud” Herman Hesse
Discuss, discuss, discuss. This is by far the most important phase of planning. You’ll be able to further revise, review and categorize to determine what’s needed as preparation for execution.
Next up: Execution
I’d like to thank everyone for the feedback I have received thus far via emails, comments, phone calls and direct messages.
Your feedback is ultra-important and has made me a clearer thinker and better writer as I journey through this process.
I thought I would share questions I have received thus far.
Thank you!
Alvin

“Ideas shape the course of history” John Maynard Keynes
A simple patterned approach to idea generation.
Tip: Trust the process.
It’s difficult at the start. When pressured to create, pivot or course correct, the process to generate the way forward, “The Idea”, feels insurmountable. It’s important to note is that this is normal.
It’s normal to feel overwhelmed and stressed. Stress is a biological and psychological response when we feel we do not have the resources to deal with threats encountered. What you are likely unaware of is that under duress, biology has started the critical thinking process automatically. The brain has started to evaluate the situation against strengths and weaknesses.
Tip: Use a simple approach to generate ideas.
Natural selection is the process that results in the adaptation of an organism to its environment. Breaking down this theory gives us a straight forward path for idea generation: Think – Variation, Fitness, Competition
Tip: Plot data on verticals
Armed with data, it’s time to plot our data on verticals.
The data above will give us the ability to categorize information on a maturity scale – High, Medium, Low within each identified vertical.
Verticals are Tao’s:
The absolute principle underlying the universe (Vision), combining within itself the principles of yin and yang (Balance) following a code of behavior (Mandate), that is in harmony with the natural order.
In the example below, I’ve plotted 5 data sets in the following verticals:
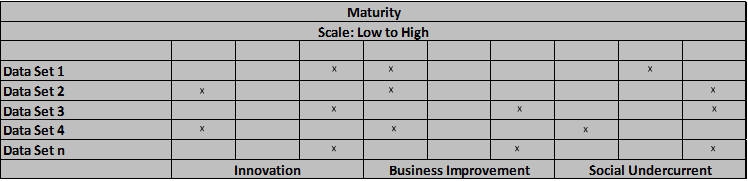
Plotting data against Verticals allows for a visual interpretation and representation of the outcomes. This holistic view in comparison to Verticals (Point of Inflection) is important to the overall transformation of an Idea to Strategy.
Strategy = Trust the process -> Start with a simple approach -> Plot data on verticals
Now that we have Idea(s) morphing into Strategy, I will share Step 2 in the Strategy to Execution process – The Roadmap.
“Strategic Thinking is the bridge that links where you are to where you want to be” John Maxwell
“Analysis is the critical starting point of strategic thinking” Kenichi Ohmae
“The stock market is a device for transferring money from the impatient to the patient” Warren Buffett
It’s easy to get tripped up in high pressure situations. Life, much like the game of chess hinges on the importance of strategy coupled with patience.
The starting point for strategic thinking calls for deep analysis through self-assessment and reflection. Utilizing simple yet effective questions such as:
As mundane as they may seem, the questions above provide insight into our current state, charting where we are, allowing us to map our new destination in a methodical and patient manner through analysis.
In my next post, I will share the parts that make up analytical thinking as it relates to idea generation, and as we progress, this blog will journey through a systematic story from idea Assessment to Execution alongside the Foundation, Framework and Adoption Principle.

“Simplicity is The Ultimate Sophistication” Leonardo da Vinci
Leonardo da Vinci, the greatest thinker who ever lived, taught us his key principles.
The Internet is a marvel and has provided us with an abundance of information. The ability to see through it, sort through it, summarize and absorb meaningful data is difficult. It requires us to reflect, self-assess, contemplate and question things systematically.
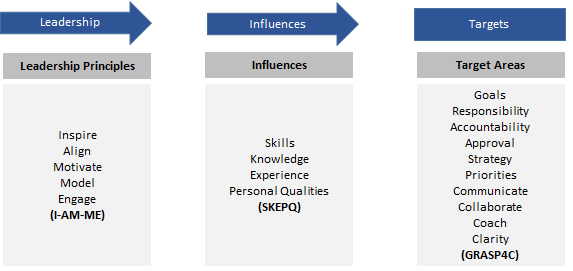
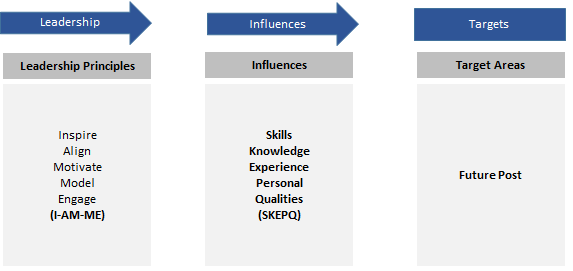
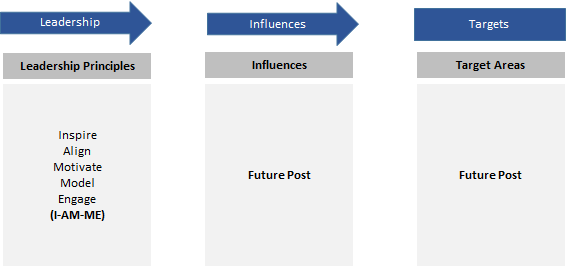
Following our Leadership Principles through the Influences gets us to the Target Areas. These targets require Leaders to utilize “Whole Brain” thinking, in baseball(when swinging at a pitch) its called the follow through.
It feels like it was yesterday.
Sometimes you have to look really really hard to find the meaning behind the experiences you’re going through. At other times, life has a way of telling you, showing you, making you feel what you should know and remember forever.
My parents called them teachable moments.
My sister and I fondly look back at those teachable moments my parents demonstrated as instances where we dodged the slipper to the back of our heads. Don’t fret, I guard and cherish those experiences and as a result of those teachable moments, I’ve developed a spidey sense of sorts. Able to dodge projectiles in a flash.
I was running towards the defender dribbling the football (Soccer to North Americans) and ran into Bernard The Brute. The kids called him a brute because he was the biggest, baddest, roughest defender known to all 10 year olds at the school. You could hear him growl at you as he ran to defend his patch of grass, get right into your face, push, pull essentially bullying the ball off the offensive player.
I don’t profess to have been the best soccer player as a child however I can comfortably say that I was a good player, a player some looked to for leadership and to model.
I anticipated this would happen, Bernard would run at me. He thought that like countless other times I would inevitably give up the ball. Not because he was better, not because he took it off of me, but because I was scared. I didn’t want to admit it at the time, but it’s the truth.
What Bernard didn’t know was that I was waiting for that moment. I knew what I had to do.
The moment that prepared me for Bernard was when I watched my parents put in their application to migrate to Canada. I didn’t understand most of what was happening however one thing stood out. It was a difficult moment, I could feel it.
I asked my father one question. “How do you know you will have a career in Canada as an Aircraft Engineer? You don’t know anything about Canada or the expectations.” (Please remember this was before the Internet)
His response prepared me for Bernard.
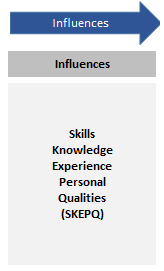
He said the following “Never forget who you are, what you are, where you are, what you know and smile, SKEPQ, SKEPQ, SKEPQ”
I blinked then he followed up with “I will use my Skills, Knowledge, Experiences and Personal Qualities son, do that, you will be fine”.
So that day, Bernard got a taste of SKEPQ. I danced, dodged, scored then smiled.
What does this all have to do with Leadership Influences?
Leaders need to draw on their SKEPQ in order to drive their Principles forward.
It’s part of the Leadership puzzle. Do this, you will be fine.
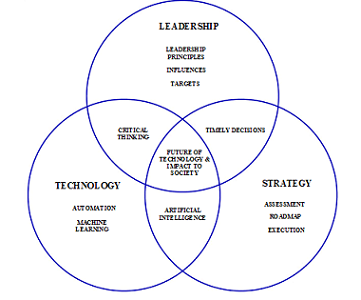
Leadership by definition is leading a group of people or an organization with synonyms such as guidance, direction, control, management and supervision.
I believe that Leadership is nuanced, a subtle mix of Inspiration, Alignment, Motivation, Behavior Modelling and Engagement.
With the current fast paced cadence of technology innovation and businesses willing to adopt leading and bleeding edge ideas, the role of Technology Leadership is more important than ever. It requires acute critical thinking, a razor sharp focus on strategy, an effective efficient execution path and most importantly, timely decision making.
I’ll delve a bit deeper in future posts with respect to the Influences leaders must reference to drive their Leadership Principles, while being mindful of the specific Target Areas to deliver on positive business outcomes.


Biomimicry by definition is the design and production of materials, structures and systems that are modeled on biological entities and processes.
Innovation inspired by Nature.
This has already started to happen and I believe is one of multiple ways in which Technology and Biology intersect.
https://www.digitaltrends.com/cool-tech/biomimicry-examples/
https://www.fastcompany.com/3000085/the-booming-business-of-biomimicry
In my previous entry, analysis and corresponding data show how internal and external demands of the Auto Parts Manufacturing industry are created in nations that had little to no raw materials production.
France and Korea’s strong position in the global automotive market have their respective countries positioned extremely well to grow and build a top auto parts manufacturing industry.
In addition to demand, France and Korea have created successful trade partnerships by implementing meaningful regulations, tariffs, subsidies and non-tariff barriers which remove barriers and create incentives supporting the automobile and auto parts manufacturing industry.
Now it’s time to connect the dots in order to determine how and what the Canadian Federal and Provincial governments do to support and strengthen auto parts manufacturing space?
Canada’s top export destinations are the USA, China and Japan and top import partners are the USA, China and Mexico.
Top imports into Canada are Cars, Crude Petroleum and Vehicle Parts. Auto Manufacturers import these parts into Canada so that automobiles can be assembled and sold in Canada.
Recommendations:
France and Korea have successfully done the above and the results speak for themselves. With the right strategy, Canada and Ontario can develop a strong position in the world as a major supplier for auto parts.
My analysis and dissection of auto parts manufacturing has become a bit like a plane starting its landing procedure. It feels like I’ve been circling around for quite a while and it’s taking me a bit of time to land. That said, I hope to land in this entry.
In the previous entry, I discovered that I had more question::
Things are now starting to make sense. France and Korea should definitely be high on the list of exports for auto parts since they both have 2 to 3 major automobile manufacturers in their respective countries. The demand is both internal and external.
Source:
More corroborating data shows internal and external demand for auto parts in France and Korea.
Source:
What type of international trade regulation exists between Korea and China, France and Germany?
France and Germany – Trade regulation highlights
Korea and China – Trade regulation highlights
http://trade.gov/topmarkets/pdf/Autoparts_Top_Markets_Report.pdf
Other key factors to consider when looking at international trade regulations between France and Germany, Korea and China:
To summarize:
France and Germany, Korea and China have eased trade regulations and created solid partnerships that bolster each countries economic conditions. One industry that benefits from this partnership is the Automotive Parts Manufacturing sector in both France and Korea.
The data above shows us that both internal and external demand in combination with eased trade regulations have propelled both auto parts manufacturing and automobile manufacturing in France and Korea to top 6 in the world.
In my next post, I will take what I’ve learned to delve into a deeper look at Canada’s import/export story , trade partnerships and existence of subsidies, tariffs and non-tariff barriers
In my previous post, I decided to take look at the top 100 companies in the world in order to determine how many are from France and Korea.
I found that aside from the #7th largest auto parts company in the world, France also had the #15th and #40th largest company. Korea was even more impressive, aside from the #8th largest auto parts company, Korea also boasts the #38th, #46th, #70th and #90th. Super impressive.
In order to gain some insight in to how France and Korea accomplished this, I started by looking for answers to the questions below.
(6)Who needs automotive parts?
(7)Why don’t Automotive manufacturers produce their own parts?
(8)Why do Automotive manufacturers setup in emerging markets?
(9)Why has the automotive industry remained regionalized?
(10)Why have Auto Supplier contributions increased from 56% to 82% in 2015?
(11)For automakers to produce more cars, what are the downstream impacts to industry,
jobs, economy?
It seems simple enough to determine that Automobile Manufacturers need Automotive Parts. Doesn’t get any easier than that right.
So why don’t Automotive Manufacturers produce their own parts?
Why do automotive manufacturers setup in emerging markets?
Why has the automotive industry remained regionalized?
Why have auto supplier contributions increased from 56% to 82% in 2015?
For automakers to produce more cars, what are the downstream impacts to industry, jobs, economy?
So where to go from here? After answering the questions above, I’ve had more questions albeit more specific to France and Korea, and ultimately lessons learned that Canada could adopt in order to answer question posed by the Red Tape challenge.
There you have it – more questions. One thing is for sure, I’ve learned a lot about this topic in just 2 days. Look out for part 4 coming this week.
In my previous post, I compared raw materials production Mean scores of countries that have companies in the top 10 for Auto Parts Manufacturing. I was looking for data that would confirm my initial assumption that countries with a larger share of raw material production would have a greater number of companies in the top 10 for Auto arts Manufacturing.
The data indicates that this assumption is incorrect.
The USA was the run away winner with a Mean score of 4.29. In second place was Japan with 6.71. If my assumption was correct, the USA would have have the greatest percentage Auto Parts Manufacturers in the top 10; however this was not the case.
Putting the USA data aside, France and Korea had high scores of 9.14 and 10. Those nations had very little raw material production but somehow had 1 company each in the top 10.
This generated the normal set of questions around France and Korea – Why? How?
I started to think that I should look at top 100 companies and count how many were based in France or Korea. I read somewhere that the initial investment needed to start up an Auto Manufacturing plant was extremely high, perhaps this was also the case for Auto Parts manufacturers, acting as roadblock for new firms to startup in France and Korea.
The Ontario Red Tape Challenge question:
“Ontario is committed to developing modern, outcome-focused and evidence-based regulations. Tell us how you think we can improve regulations to better support business. By reducing the burden to business while protecting consumers, workers and the environment, Ontario is helping to create the right climate to create jobs and grow the economy.”
Next post will be more about France and Korea.
Ontario is crowd sourcing thoughts and ideas in order to develop modern, outcome-focused, evidence based regulation. https://www.ontario.ca/page/red-tape-challenge
I decided to tackle one six categories identified – Automotive Parts Manufacturing.
Red tape Challenge:
Where to start?
I decided to start from the Macroview(MAC) then to the Microview(MIC)
MacroView
(1)Identify top 10 companies that manufacture auto parts for the world and focus on their main manufacturing base (country)
(2)List products manufactured, list the markets where their products are sold
(3)What are the upstream factors in automotive manufacturing that have a
significant impact to employment?
(4)How does an improvement in regulation help create jobs, grow the economy while
reducing burden to business, protecting customers, workers and the environment?
(5)Determine policies at Federal/Local levels that meet the following goals:
(a)Reduce Burden on Business
(b)Protect Customers
(c)Protect Workers
(d)Protect the Environment
(e)Promotes job growth which inherently grows the economy
(6)Who needs automotive parts?
(7)Why don’t Automotive Manufacturers produce their own parts?
(8)Why do Automotive Manufacturers setup in emerging markets?
(9)Why has the automotive industry remained regionalized?
(10)Why have Auto Supplier contributions increased from 56% to 82%?
(11)For automakers to produce more cars – What are the downstream impacts to industry,
jobs, economy?
MicroView
(1)For each country identified as a top parts producer, look to upstream manufacturing and regulation.
(2)Correlate regulations – major auto parts manufacturing countries vs Canadian regulations
(3)What should the Canadian government focus on in order to boost Auto Parts Manufacturing?
(4)What are the top 3 regulation changes upstream that would have the largest impact
downstream to Canadian Auto Parts Manufacturers?
Top 10 companies in the world that manufacture auto parts:
Source:https://www.autonews.com/assets/PDF/CA89220617.PDF
Robert Bosch GmbH - Stuttgart, Germany
 Gasoline systems, diesel systems, chasis system controls, electrical drives,
 starter motors & generators, car multimedia, electronics, steering systems, battery
 technology, exhaust gas turbochargers and treatment systems
 36.787B
 North American Percentage - 17
 Europe Percentage - 52
 Asia Percentage - 27
 Rest of the world - 4
 Top 3 locations
 Germany - 112300 employees
 India - 26000 employees
 North America - 24750 employees

Denso Corp, Kariya, Japan
 Thermal, Powertrain control, electronics & electrical systems,small motors, telecommunications
 34.200B
 North American Percentage - 16
 Europe Percentage - 11
 Asia Percentage - 71
 Rest of the world - 2
 Japan - 132276 employees
 North America - 17000 employees

Continental AG, Hanover, Germany
 Electronic & Foundation brakes, stability management systems, tires,chasis systems, safety system electronics, telematics, powertrain electronics,interior modules, instrumentation, technical elastomers
 32.8B
 North American Percentage - 21
 Europe Percentage - 50
 Asia Percentage - 25
 Rest of the world - 4
 Germany - ? employees
 Argentina - ? employees
 Costa Rica - ? employees
 North America - 1600 employees

Magna International, Aurora, Ontario
 Bodies, chasis, interiors, exteriors, seating, powertrain, electronics,mirrors, closures & roof systems & modules
 North American Percentage - 53
 Europe Percentage - 40
 Asia Percentage - 0
 Rest of the world - 7
 Canada, Mexico, USA - 65000 employees
 Europe - 55000 employees
 Brazil, Argentina - 3500 employees
 Asia - 17700 employees

Aisin Seiki Co, Kariya, Japan
 Body, brakes & chasis systems, electronics, drivetrain & engine components
 30.08B
 North American Percentage - 14
 Europe Percentage - 10
 Asia Percentage - 76
 Rest of the world - 0
 Japan - 78000 employees
 North America - 8000 employees

Johnson Controls, Milwaukee, USA
 Seating, overhead systems, door & instrument panels, center & overhead consoles & interior electronics, lead acid & hybrid vehicle batteries
 22.515B
 North American Percentage - 41
 Europe Percentage - 47
 Asia Percentage - 12
 Rest of the world - 0

Faurecia, Nanterre, France
 Seating, emissions control technologies, interior systems, exteriors
 22.500B
 North American Percentage - 27
 Europe Percentage - 56
 Asia Percentage - 10
 Rest of the world - 7

Hyundai Mobis, Gangnam-Gu Seoul, Korea
 Chasis, cockpit & front-end modules, ABS, ESC, MDPS, airbags, LED lamps, ASV parts, sensors, electronic control systems, hybrid car powertrains, parts & power control units
 21.351B
 North American Percentage - 22
 Europe Percentage - 11
 Asia Percentage - 67
 Rest of the world - 0

ZF Friedrichshafen AG, Friedrichshafen, Germany
 Transmissions, chasis components & systems, steering systems, clutches dampers
 18.614B
 North American Percentage - 19
 Europe Percentage - 58
 Asia Percentage - 18
 Rest of the world - 5

Yazaki Corp, Susono City, Japan
 Wiring harnesses, connectors, junction boxes, power distribution boxes,instrumentation, high voltage systems
 15.801B
 North American Percentage - 22
 No other information available
(3) What are the upstream factors in Automotive Manufacturing that have a
significant impact on employment? Consider top 10 companies for auto parts manufacturing and their country of operation: Germany, Japan, Canada,USA, France, Korea. Allocate a score for how countries rank against raw materials production)
Materials: Steel, Aluminum, Glass, Fossil Fuel, Software, Rubber, Plastic
Verdict:
Mean score out of 7 categories. Default rank is 10 if no rank or greater than 10. Lower scores are better.
What’s I find interesting – 3 of the top 10 companies who manufacture Auto Parts are based in Germany however Germany ranks 3rd in the overall mean score for materials required to produce Auto Parts.
Despite having a clear advantage in raw materials for Auto Parts, the USA only has 1 company that ranks top 10, tied with Canada.
Japan ranks high on the Mean scale however has 3 companies in the top 10 for Auto Parts manufacturing.
Note: The data indicates that raw materials are not the most important factor for a successful top 10 Auto Manufacturing businesses.
France and Korea are good models to study as they are not in the top 10 for raw material production however have the #7 and #8 Auto Manufacturing companies in the world.
I will focus on France and Korea in order to determine the top three factors that allow for a top 10 showing in world Auto Parts Manufacturing.
More to come in blog #2
Information on the bubbly nature of the Canadian housing market has reached frothy levels. I’d say that there is an information bubble occurring around media reports covering the housing bubble in Canada. Media articles and reports include splashy headliners like Hillard McBeth, Garth Turner and Kevin O’Leary to support the case of the housing bubble
At first glance, the media reports include information that I tend to agree with, however I have an uneasy feeling that I’ve based my opinions on a singular perspective and this has left me with some significant unanswered questions.
I’d like to analyze these questions one at a time and to start off I’ll take a look at the following.
Part 2 will delve into greater details. However the first step in my analysis was to look for trends in Canadian housing.
Canadian Real House Price Index
http://www.macleans.ca/economy/realestateeconomy/a-canadian-housing-chart-that-puts-the-bubble-in-perspective/
Years considered 1980 – present
4+4+7+6 = 21 trends
3+6+3+0= 12 valleys
12/40 = 30% occurrence of Valleys in 4 decades
21/40=52.5% occurrences of Trends up in 4 decades
Allot 5 years for valley and 5 years for trend up to create a baseline
Breakdown allowed per year
30/5 = 6% probability of a Valley each year
52.5/5 = 10.5% probability of a Trend up each year
In future posts, I will gather and analyze factors in order to dial up/ dial down the 25% probability of a valley for 2016 and onward.
Update – April 28 2016
Not an overly surprising move in April 26/27 2016 announcement by FOMC that rates stay idle. Reports up to this meeting were that global economic factors weighed heavily in the minds of committee members prompting no rate movement in March 2016. The lack of movement in the rate for April is an indicator that global economic uncertainty isn’t going away and the US economy is tied to that uncertainty, the FEDs steadfast mantra of data dependency didn’t warrant an April rate move.
Here are some key items to think about going forward:
What to look for in June 14/15 2016?
The global economic environment is already complicated and seems destined to hold this path. With the pending Brexit referendum bringing uncertainty to Europe in addition to the dire state Greece’s economics is and has been may divert global investors to the US. My adjusted forecast for June 2016.
Update – April 7th 2016
We are in interesting territory as reports indicate inflation has edged closer to the FED target of 2%. With month after month of positive employment numbers reported from the US and GDP by 1.4% in Q4 2015 what’s holding the FED back from raising rates in April?
The US is playing defense against global markets. The world has caught a financial cold.
With statements like this “a core group of policymakers who appeared to include Fed Chair Janet Yellen did not believe the market’s roller-coaster ride this year was over. Several “expressed the view that the underlying factors abroad that led to a sharp, though temporary, deterioration in global financial conditions earlier this year had not been fully resolved and thus posed ongoing downside risks.”” I have adjusted the Global Market indicator to reflect the negative news and sentiment awash in global financial markets.
Global Market indicator adjusted from 10 to 7. All other indicators stay the same bringing the probability of a rate increase in April to 52%.
Update – March 29th 2016
Taking all that into account: April 2016 outlook is as follows
Source:
March 2016 is here and my prediction that the FEDs would raise their rates was incorrect. First things first, I will revisit the weight for the 5 categories I took into consideration in my initial analysis. Second, I will add a % likelihood of whether the FEDs would raise rates.
The report out of the FED today indicated two reasons on the rate hold as opposed to a rate increase – https://www.federalreserve.gov/newsevents/press/monetary/20160316a.htm
Inflation and jobs
My research and reading indicate that it is very difficult to predict the sudden rise of inflation and the efforts to curtail this rise would take dramatic action from the FED. The jobs numbers are something that have been highly discussed and debated over the last number of months.
Some analysts have pointed out that the FEDs mandate of “full employment” has been reached and that this is an indicator that inflation is about to be dialed up. On the flip side of the argument, others have indicated the current jobs numbers reporting”full employment” isn’t really what it seems once the jobs numbers are drilled down in order to take into consideration the quality of jobs over quantity.
The FEDs themselves have not indicated the meaning of “full employment” however their statement today gave us a glimpse.
“Consistent with its statutory mandate, the Committee seeks to foster maximum employment and price stability. The Committee currently expects that, with gradual adjustments in the stance of monetary policy, economic activity will expand at a moderate pace and labor market indicators will continue to strengthen.”
With the above statement, could the FED be indicating that jobs numbers aren’t what they seem and would like to see continued dialing up to be sure? Perhaps.
Global economic and financial developments
With regards to the FEDs consideration of the global economic conditions and their stance today. It’s no secret that world economies are connected. Reports from all around the world are that countries and economies not named USA are in trouble. The powerful US economy would be adversely impacted by the economic challenges these countries are currently facing.
Revised numbers for March 2016. April 2016 outlook revised.
| Inflation PCE Indicators
Weight:35% New:30% |
GDP
Weight:25% New: 20% |
Global Markets
Weight:20% New: 35% |
Employment Rate
Weight:15% New:10% |
Fed Balance Sheet
Weight:5% |
Outcome:
FED Target 75 Recovery Target New: 100 Normal Economic conditions target: 80 |
Prediction | |
| March 2016 | 25 – Trending up
15 |
25
15 |
5 | 15 – Trending up
7 |
5 | 75
47% chance the FEDS raise rates |
March 15/16 – Rates go up .25%
Decision was to stand pat |
| April 2016 | 16 | 15 | 10 | 8 | 5 | 54 | April 26/27 – 54% chance rates go up |
Updated April 15th 2016 – Round 1 Playoff match-up and outcomes.
EAST:
West
Here are the questions this post will attempt to predict:
End of season records and playoff rankings:
| Teams | Conference | Regular Season Record | Seed |
| Cleveland | E | 57-25 | 1 |
| Toronto | E | 53-29 | 2 |
| Miami | E | 48-34 | 3 |
| Boston | E | 44-38 | 4 |
| Atlanta | E | 43-39 | 5 |
| Charlotte | E | 43-39 | 6 |
| Washington | E | 43-39 | 7 |
| Indiana | E | 42-40 | 8 |
| Golden State | W | 74-8 | 1 |
| San Antonio | W | 63-19 | 2 |
| OKC | W | 55-27 | 3 |
| LA Clippers | W | 53-29 | 4 |
| Memphis | W | 47-35 | 5 |
| Portland | W | 47-35 | 6 |
| Dallas | W | 42-40 | 7 |
| Houston | W | 41-41 | 8 |
| Round 1 | Team | Team | Result |
| EAST | Cleveland | Indiana | Cleveland in 6 |
| EAST | Toronto | Washington | Toronto in 6 |
| EAST | Charlotte | Miami | Charlotte in 7 |
| EAST | Atlanta | Boston | Atlanta in 6 |
| Round 1 | Team | Team | Result |
| WEST | GSW | Houston | GSW in 6 |
| WEST | San Antonio | Dallas | San Antonio in 6 |
| WEST | OKC | Portland | OKC in 6 |
| WEST | LA Clippers | Memphis | LA Clippers in 6 |
| Round 2 | Team | Team | Result |
| EAST | Cleveland | Atlanta | Cleveland in 6 |
| EAST | Toronto | Charlotte | Toronto in 7 |
| WEST | GSW | LA Clippers | GSW in 6 |
| WEST | OKC | San Antonio | OKC in 7 |
Conference Final EAST:
Finals: http://espn.go.com/nba/hollinger/teamstats/_/sort/paceFactor
Prediction: Toronto over Cleveland in 7
Raptors leads the season series 2-1
| Category | Details | Details | Result |
| Player Depth Chart | |||
| Lowry/Joseph | Irving/Williams | Advantage Toronto | |
| JV/Biyombo | Thompson/Mozgov | Tie | |
| Caroll/Johnson | James/Jefferson | Advantage Cleveland | |
| DeRozan/Ross | Smith/Shumpert | Advantage Toronto | |
| Scola/Patterson | Love/Frye | Tie | |
| Grade | Toronto with the Advantage | ||
| Category | Detail | Detail | Result |
| Defensive Efficiency | Cleveland | Toronto | |
| 101.4 | 102.4 | Virtual Tie | |
| Offensive Efficiency | 106.7 | 106.4 | Virtual Tie |
| Pace | 95.2 | 95.3 | Virtual Tie |
| Turn Overs | 12.3 | 12.4 | Virtual Tie |
| TS – True Shooting Percentage | 55 | 55 | Tie |
The EAST Finals will be a test between two teams that are virtually tied almost all categories. The factor that will put Toronto over Cleveland in my estimation is the MVP play of Lowry this season. Add the stellar play of DeRozan and the return of Caroll’s defensive on LeBron. The Raptors should take this one in a 7 game series.
Conference Final WEST:
Prediction: GSW over OKC in 6
GSW lead season series 3-0
1 Win in OT
| Category | Details | Details | Result |
| Player Depth Chart | GSW | OKC | |
| Curry/Livingston | Westbrook/Payne | Advantage GSW | |
| Thompson | Waiters | Advantage GSW | |
| Bogut/Ezili | Adams/Kanter | Advantage OKC | |
| Green/Speights | Ibaka/Collison | Advantage GSW | |
| Barnes/Iguodala | Durant/Singler | Advantage OKC | |
| Grade | GSW with the Advantage | ||
| Category | Detail | Detail | Result |
| Defensive Efficiency | GSW | OKC | |
| 100.2 | 103 | Virtual Tie | |
| Offensive Efficiency | 112.5 | 109.8 | Advantage GSW |
| Pace | 102.2 | 99.4 | Advantage GSW |
| Turn Overs | 13.5 | 13.8 | Virtual Tie |
| TS – True Shooting Percentage | 59.2 | 56.5 | Advantage GSW |
Prediction: GSW win series in 6 games
Althought the depth chart indicates the teams are tied in player depth chart. No other player in the league has had this level of positive impact on players around him since Michael Jordan. Steph Curry’s play trumps all depth chart matchups giving the Warriors the edge.
GSW has the edge on offensive efficiency, play at an extremely high pace and shoot a higher percentage. The Warriors will take this matchup in 6 games over OKC.
NBA Finals:
Prediction: GSW over Toronto in 6
In order to analyze the head to head matchup between GSW and Toronto, I will consider the following categories.
Season Series Cumulative Scores
Player Depth Chart without best player
Grade: GSW
Season Offensive Rebounding:
Season Defensive Rebounding:
Season Field Goal Precentage:
Head to Head comparison vs Season Averages
Game 2 Field Goal Percentage:
Grade: Raptors show they can hold GSW down from their league high field goal percentage
Game 1 Offensive Rebounds:
Game 2 Offensive Rebounds:
Grade: Raptors show their edge on the offensive glass
Game 1 Defensive Rebounds:
Game 2 Defensive Rebounds
Grade: Warriors show their resilience in game 2 by out working the Raptors on the defensive glass by a significant margin
Prediction: GSW win series in 6
The Warriors have proven time and time again that their offense is stellar and second to none. However in the head to head match up, Toronto gave GSW everything they could handle. The Raptors have shown that with some effort, their defensive capabilities can limit the Warriors to second chance points. This assumption is based on the expectation that the Warriors will miss more than they make. Thus far, the best team in the NBA and likely ever, have shown us their propensity to score in bunches and score fast.
I can envision the Raptors putting up a fight, however my prediction is GSW in 6 games over the Toronto Raptors.
MVP: Stephen Curry
Changed my mind: Analysis below
Here are my predictions for FOMC Interest Rate announcement for 2016. I will circle back and add some notes in order to analyze the outcome of my predictions
| Month | Prediction |
| March 2016 | March 15/16 – Rates go up .25% |
| April 2016 | April 26/27 – Rates go up .25% |
| June 2016 | June 14/15
Rates stand pat |
| July 2016 | July 26/27
Rates stand pat |
| September 2016 | Sept 20/21
Rates stand pat |
| November 2016
American Elections Nov 8th 2016 |
Nov 1/2
Rates stand pat |
| December 2016 | Dec 13/14
Rates go up .25% |
Question: When will FOMC raise rates in 2016
Assume that FOMC looks at 5 Open Market conditions and assign a weight to each condition.
In order of priority for FOMC for a rate increase
| Inflation PCE Indicators
Weight:35% |
GDP
Weight:25% |
Global Markets
Weight:20% |
Employment Rate
Weight:15% |
Fed Balance Sheet
Weight:5% |
Outcome:
Fed Target 75 |
Prediction | |
| Feb 2016 | 15 | 25 | 5 | 10 | 5 | 60 | |
| March 2016 | 25 – Trending up | 25 | 5 | 15 – Trending up | 5 | 75 | March 15/16 – Rates go up .25% |
| April 2016 | 25 | 25 | 5 | 15 | 5 | 75 | April 26/27 – Rates go up .25% |
| June 2016 | 20 | 25 | 5 | 15 | 5 | 70 | June 14/15
Rates stand pat |
| July 2016 | 20 | 25 | 5 | 15 | 5 | 70 | July 26/27
Rates stand pat |
| September 2016 | 20 | 25 | 5 | 15 | 5 | 70 | Sept 20/21
Rates stand pat |
| November 2016
American Elections Nov 8th 2016 |
20 | 25 | 5 | 15 | 5 | 70 | Nov 1/2
Rates stand pat |
| December 2016 | 25 | 25 | 10 | 15 | 5 | 80 | Dec 13/14
Rates go up .25% |
I started my analysis in Feb 2016. Please excuse the format – this was me trying to analyze and organize my thoughts.
“And that house on the hill when you drop like 80
On a down payment thinking damn ain’t life gravy” – J.Rule


